
Precisa Series 340 prepASH Thermogravimetric Analyzer TGA
Automatic ashing and drying systems (macro TGA) Series 340 prepASH®

The PHI Quantera II is an XPS instrument which can produce a micro-focused, raster scanned x-ray beam with a minimum beam size of 7.5 μm in diameter.
In addition to superior micro area performance, the PHI Quantera II offers high throughput automated analysis and depth profiling.
ULVAC-PHI has been successful in improving the quality of the patented monochromatic, micro-focused, scanning x-ray source which is the core technology of the PHI Quantera II. Improvements in the quality of the monochromatic crystal enabled the x-ray beam size down to 7.5 μm in diameter. Micro area XPS sensitivity has also improved by 20%.
The PHI Quantera II can also perform high resolution average, area, linear, and multi-point analyses of large areas by using both high-speed XPS and dynamic emittance matching.
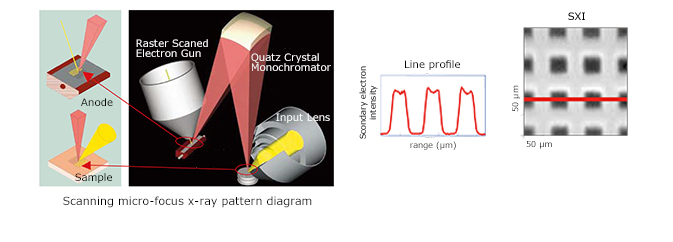
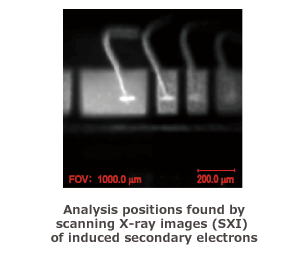
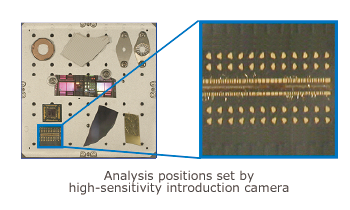
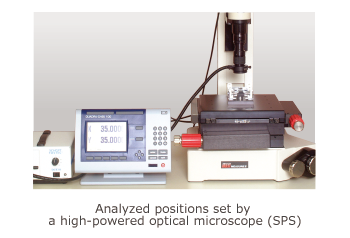
Fig. 1-a and 1-b shows an optical image (taken using PHI Quantera II’s sample positioning station) and an x-ray beam induced secondary electron image (SXI). We can clearly identify the blue, green, and red pixels in Fig. 3a, tens of microns away from each other, in Fig. 1-b. This shows with the PHI Quantera II, we can confidently locate the analyzing point on the sample, including insulators.
By using the charge neutralizer used in XPS for SXI, we can locate the exact same point on both.
Fig. 1-c shows an example of survey spectra done simultaneously obtained from depth profiling, using a 10 μm diameter x-ray beam, on the blue, green, and red pixels. The PHI Quantera II is the only XPS instrument that can conduct micro area depth profiling on various samples within what we offer on a standard basis.
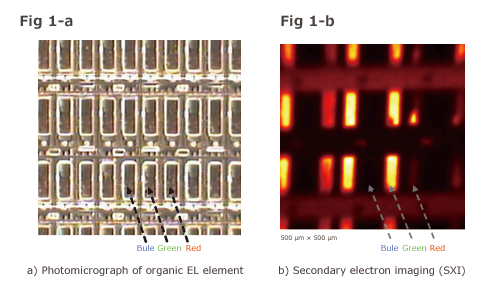
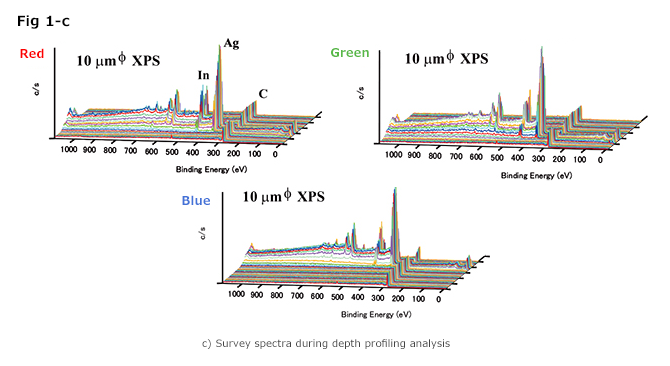
Fig 1, Depth profiling analysis by survey spectrum of electrode
XPS is used in elemental analysis on a wide range of samples ranging from insulators to conductors. However, resetting the charge neutralization, when analyzing insulators, was a heavy task for the user.
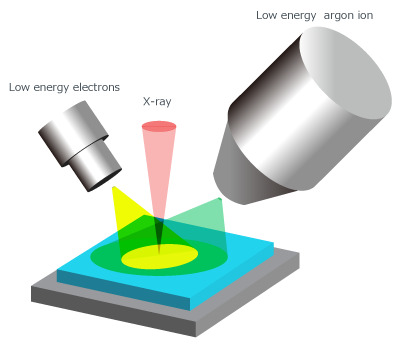
The PHI Quantera II uses the PHI’s patented dual beam charge neutralization using low-energy electron beam and ion beam simultaneously allowing automated analysis for insulators. This has also made automated height alignment easier.
The PHI Quantera II is equipped with a high efficient input lens and 32 channel detector used to attain high sensitivity spectra vital for micro area qualitative and quantitative analyses. This enables simultaneous high sensitivity unscanned spectrum acquisition and imaging. The MultiPak, data reduction software offers a variety of tools for data reduction, including linear least squares fitting and curve fitting.
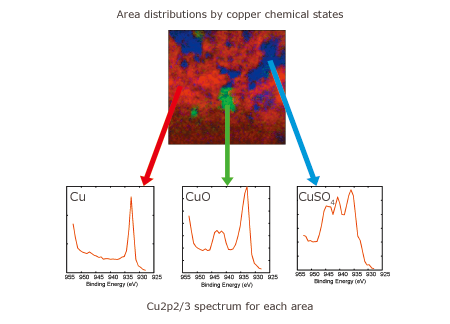
The bottom figure shows a chemical imaging of oxide (CuO) and sulfate (CuSO4) on a copper surface. The red, green, and blue parts show the Cu 2p spectrum of Cu, CuO, and CuSO4 after linear least squares fitting. The bottom figure shows spectra extracted from the image.
The SXI image is an image of the secondary electrons, excited by the micro-focused x-ray source, taken in by the analyzer. Using the actual x-ray used for analyzing enables accurate and quicker point and click analysis area definition.
We can determine the analyzing point from the high resolution photo take at the introduction chamber. The digital zoom function enables accurate and quick navigation.
The sample positioning station is a digital XY coordinate device using an optical microscope. This device will help navigate the analyzing point by using the image taken by the optical microscope and the point on the digital XY coordinate.
Brochure
XPS

Automatic ashing and drying systems (macro TGA) Series 340 prepASH®

The RB36 5G: Ring & Ball is designed for measuring product temperatures from 0°C to 220°C. The instrument enables simultaneous testing of two samples with independent monitoring.

The VIDA ML density meter is specifically designed for mobile laboratory applications providing accurate and repeatable density analysis for a wide range of liquids according to ASTM D4052.

Next evolution of (Micro-XRF) micro-X-Ray Fluorescence Spectroscopy; Ultimate performance in speed and flexibility


The HD-2700 is an 80-200 kV field-emission-gun scanning transmission electron microscope (STEM) with secondary electron (SE) imaging capability. Bulk and surface structures of a specimen can be imaged simultaneously.
You may contact our specialists by accomplishing form below.
You may contact our specialists by accomplishing form below.